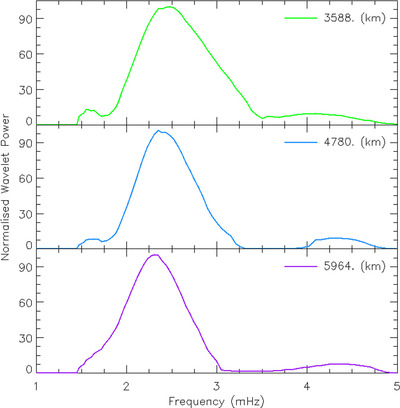
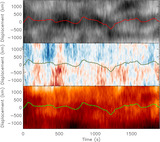
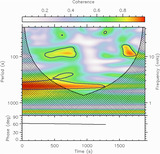
Wavelet power spectra calculated from the time series of Hα GTS line width shown in Figure 11. The colors correspond to the locations of the cross-cuts used for measurement shown in Figure 3. Each power spectrum shows a significant power at approximately 410 s.