Image Details
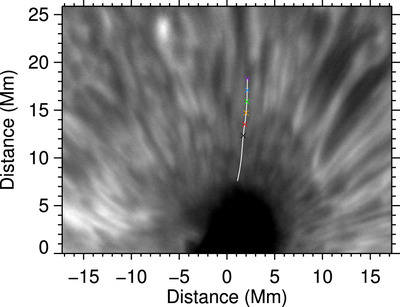
Caption: Figure 3.
The example fibril analyzed in Section 4 is shown overplotted as a white line on a line-core Hα intensity image. The location of the cross-cuts that were taken are marked by colored crosses, with the colors corresponding to those in Figure 11.
Other Images in This Article
Show More
Copyright and Terms & Conditions
© 2024. The Author(s). Published by the American Astronomical Society.
Copyright ©
2025 Astronomy Image Explorer. All Rights Reserved.