Image Details
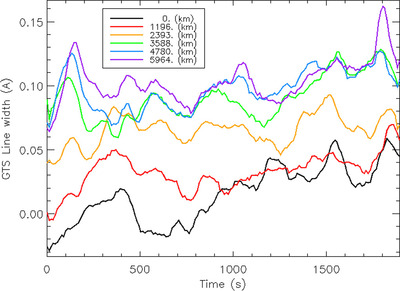
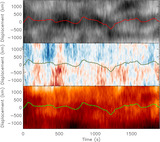
Caption: Figure 11.
The GTS Hα line width calculated at different locations along the fibril. The colors correspond to those shown in Figure 3.
Other Images in This Article
Show More
Copyright and Terms & Conditions
© 2024. The Author(s). Published by the American Astronomical Society.
Copyright ©
2025 Astronomy Image Explorer. All Rights Reserved.