Image Details
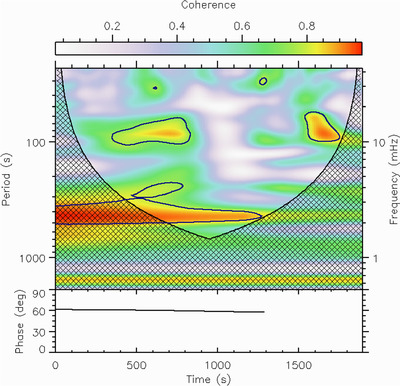
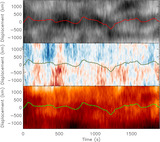
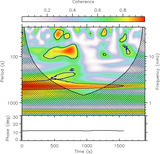
Caption: Figure 8.
A cross-wavelet coherence spectrum between the FAF x-displacement and the FAF y-velocity measured at the cut location denoted by the green cross in Figure 3. The cone of influence is shown by the hashed region; the contour is at a 0.8 coherence level. The lower panel shows the phase angle measured at the dominant frequency (∼430 s) as a function of time.
Other Images in This Article
Show More
Copyright and Terms & Conditions
© 2024. The Author(s). Published by the American Astronomical Society.
Copyright ©
2025 Astronomy Image Explorer. All Rights Reserved.