Image Details
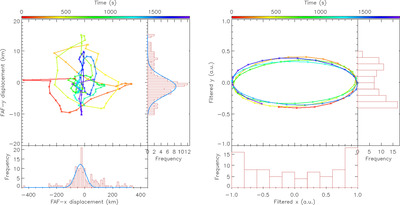
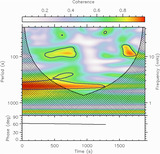
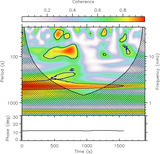
Caption: Figure 9.
Hodograms representing the path that the fibril oscillation takes in the FAF x- and y-directions from an end-on view, i.e., the path it would trace out on the gray x, y plane marked in Figure 6. The left panel shows the raw data and the right panel shows the Fourier-filtered data for the 430 s oscillations under consideration. Time is represented by the colors indicated by the color bar at the top. The histograms on the bottom and right of each panel show how long the fibril spends at each of the FAF x- and y-positions, respectively. These measurements were taken at the location of the orange cross-cut in Figure 3. It should be noted that the amplitude of the oscillations in the FAF y-direction shown in the left panel are over an order of magnitude smaller than those in the FAF x-direction.
Other Images in This Article
Show More
Copyright and Terms & Conditions
© 2024. The Author(s). Published by the American Astronomical Society.