Image Details
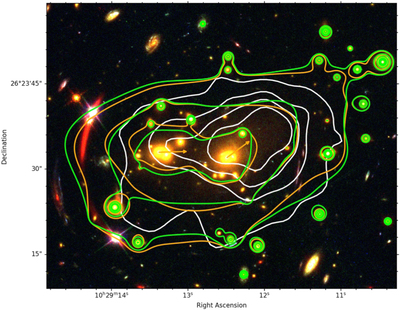
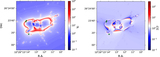
Caption: Figure 8.
Color-composite image of the central region of SDSS1029, where we compare the contour levels of the total surface mass density distribution and the Chandra X-ray surface brightness (in white, after masking the strong emission from the three QSO images). Orange and green contours correspond, respectively, to the best-fit Models 1 and 2, and the levels are [1.0, 1.5, 2.5] × 109 M⊙ kpc−2. The orange arrows indicate the orientation of the large-scale DM halos in Model 1.
Other Images in This Article

Copyright and Terms & Conditions
© 2022. The Author(s). Published by the American Astronomical Society.
Copyright ©
2025 Astronomy Image Explorer. All Rights Reserved.