Image Details
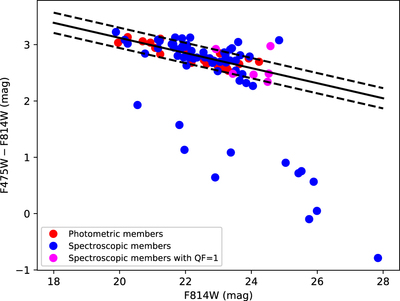
Caption: Figure 2.
Color–magnitude relation of SDSS1029 spectroscopic members (blue dots). Red dots mark the photometrically selected cluster members, according to the red sequence, and the magenta dots are the spectroscopic members with QF = 1. The best fit of the spectroscopic red sequence is indicated in black, and the dashed lines represent the 68% confidence limits.
Other Images in This Article

Copyright and Terms & Conditions
© 2022. The Author(s). Published by the American Astronomical Society.
Copyright ©
2025 Astronomy Image Explorer. All Rights Reserved.