Image Details
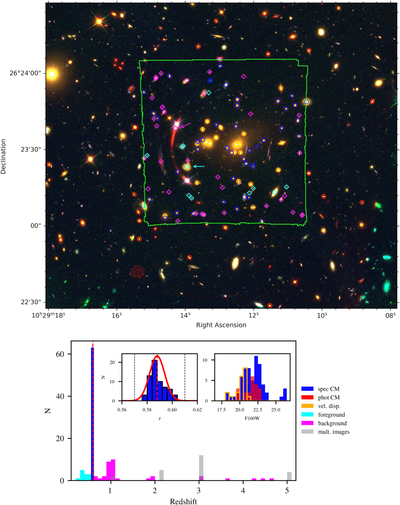
Caption: Figure 1.
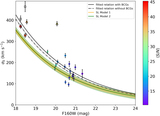
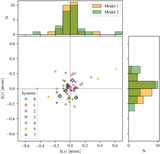
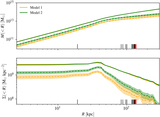
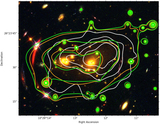
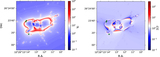
Top: Color-composite RGB image of SDSS1029, constructed with the HST/ACS passbands F435W (blue), F814W (green), and F160W (red). The MUSE footprint is shown in green. We show the spectroscopic and photometric cluster galaxies (as blue and red circles, respectively), and those with a reliable measurement of their stellar velocity dispersion (yellow circles). Foreground and background objects are labeled as cyan and magenta diamonds, respectively. The foreground and background objects highlighted with arrows are included in the SL modeling as described in Sections 3.4 and 3.6. Bottom: MUSE spectroscopic redshift distribution of the objects identified (QF ≥ 2) in the core of SDSS1029. The top left inset shows a zoom-in around the cluster redshift z = 0.588, as shown by the mean of the Gaussian (in red). The black dashed vertical lines locate the redshift interval [0.57, 0.61], which includes the 63 spectroscopically confirmed MUSE cluster members (of which six objects have a QF = 1). The top-right inset shows the distribution of cluster members included in the SL modeling as a function of their magnitudes in the HST/F160W filter, following the same color-coding as in the top image.
Other Images in This Article
Copyright and Terms & Conditions
© 2022. The Author(s). Published by the American Astronomical Society.