Image Details
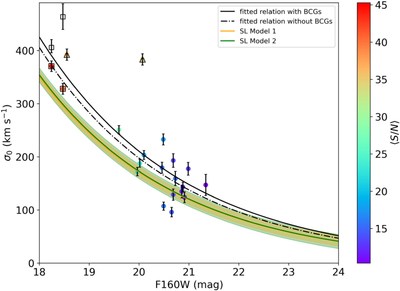
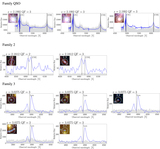
Caption: Figure 5.
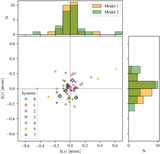
Measured stellar velocity dispersions of a subsample of 20 cluster members as a function of their magnitudes in the HST F160W filter (filled circles, whose colors depend on the 〈S/N〉 of their spectra). The black filled squares and triangles indicate the measurements of the four central galaxies. The black solid and dashed lines are the best-fit σ0–F160W relations, obtained as described in Section 3.5. The orange and green lines and areas correspond to the median and the 68% confidence level of the σ0–F160W relation from our SL Models 1 and 2, respectively. The resulting relations from the two lens models are consistent and do, in fact, overlap. We also mark as black empty squares the median velocity dispersions and associated 1σ uncertainties for the two BCGs, which are individually optimized in Model 2.
Other Images in This Article

Copyright and Terms & Conditions
© 2022. The Author(s). Published by the American Astronomical Society.