Image Details
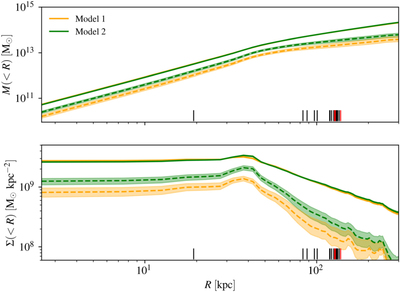
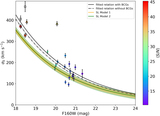
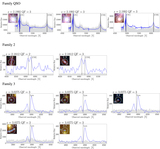
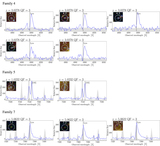
Caption: Figure 7.
Top: cumulative projected mass profiles. Bottom: average surface mass density profiles. All profiles are plotted as a function of the distance (R) from the center of the cluster. The center is fixed at R.A. = 157.°303770, decl. = 26.°392601 (marked as a cyan cross in Figure 3) for the two SL models presented in this work. The colored solid lines show the median values of the total mass and surface mass density profiles, while the dashed lines correspond to the mass component associated to the sub-halos. The shaded areas encompass the 16th and the 84th percentiles, estimated from 500 random Bayesian Markov Chain Monte Carlo realizations. The projected distances of the 26 multiple images from the cluster center are marked with vertical black lines and the distances of the three images of the quasar are highlighted in red.
Other Images in This Article

Copyright and Terms & Conditions
© 2022. The Author(s). Published by the American Astronomical Society.