Image Details
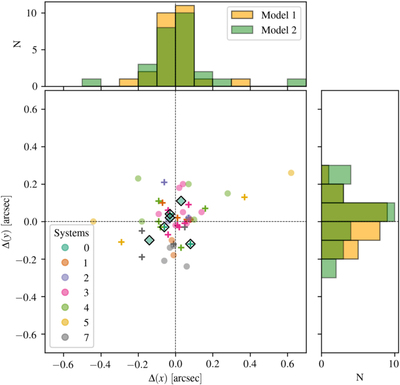
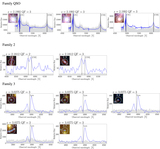
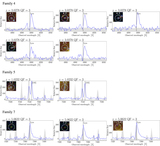
Caption: Figure 6.
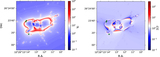
The middle panel shows the distribution of the separations Δ(x) and Δ(y) between the observed and model-predicted image positions as crosses (circles) for Model 1(2). Each system is color-coded as in Figure 3. The separations for the quasar images are, in addition, highlighted with black diamonds. The upper and right panels show the marginalized distributions of the Δ(x) and Δ(y) separations, respectively.
Other Images in This Article

Copyright and Terms & Conditions
© 2022. The Author(s). Published by the American Astronomical Society.
Copyright ©
2025 Astronomy Image Explorer. All Rights Reserved.