Image Details
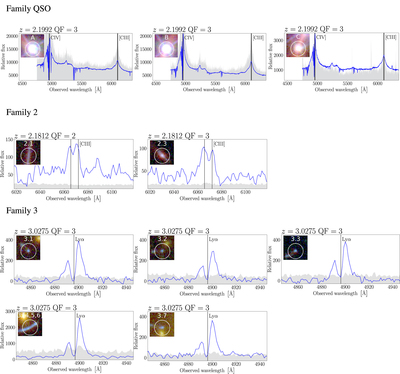
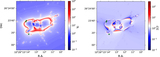
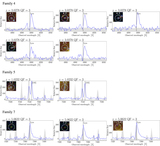
Caption: Figure A1.
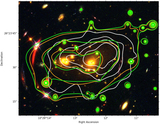
MUSE data of the multiply imaged background sources identified in SDSS1029. The vertical black lines indicate the positions of the emission lines based on the best estimate of the systemic redshift. The gray area shows the rescaled variance obtained from the data-reduction pipeline. The flux is given in units of 10 erg s−1 cm−2 Å−1. The image cutouts in each panel are extracted from the color-composite HST image and are 2″ across. The white circles show the HST counterparts.
Other Images in This Article

Copyright and Terms & Conditions
© 2022. The Author(s). Published by the American Astronomical Society.
Copyright ©
2025 Astronomy Image Explorer. All Rights Reserved.