Image Details
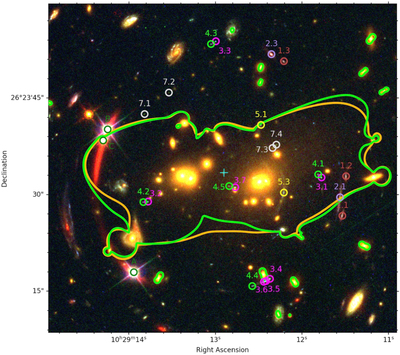
Caption: Figure 3.
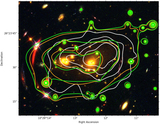
RGB image of the central region of SDSS1029, where several multiple images have been identified. We show here the images included in our SL models (listed in Table 1), following the same notation as in Oguri et al. (2013). The resulting critical curves at the quasar redshift (z = 2.1992) from our strong lensing best-fit Model 1 (in orange) and Model 2 (in green) are displayed. The cyan cross indicates the reference position from which the cumulative projected mass and average surface mass density profiles are computed.
Other Images in This Article

Copyright and Terms & Conditions
© 2022. The Author(s). Published by the American Astronomical Society.
Copyright ©
2025 Astronomy Image Explorer. All Rights Reserved.