Image Details
Caption: Figure 18.
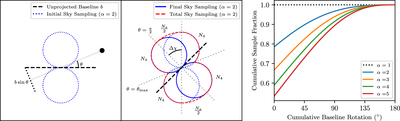
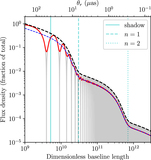
Left: schematic diagram of black holes sampled by a single baseline at one instant. The dashed black line represents the baseline, the solid gray line represents the line of sight to an example black hole, the dotted black line represents the projection of the baseline perpendicular to that line of sight, and the dotted blue curve represents the sampling function (with radial distance from the baseline center proportional to the number of black holes sampled). Middle: same as left, but after the baseline evolves, rotating by an angle Δχ, sweeping through the volume enclosed by the dashed red line. Dotted gray lines show the decomposition performed in Equation (D7). Both left and middle diagrams correspond to a two-dimensional cross-section of a three-dimensional surface; for a black hole distribution that follows ﹩\tfrac{{d}^{3}N}{d{\rm{\Omega }}d{\theta }_{r}}\propto {\theta }_{r}^{-\alpha }﹩ with α = 2, the instantaneous sampling surface is exactly a torus. Right: cumulative fraction of black holes sampled by sky density functions with increasingly steep dependence on resolution.
Other Images in This Article


Show More
Copyright and Terms & Conditions
© 2021. The Author(s). Published by the American Astronomical Society.