Image Details
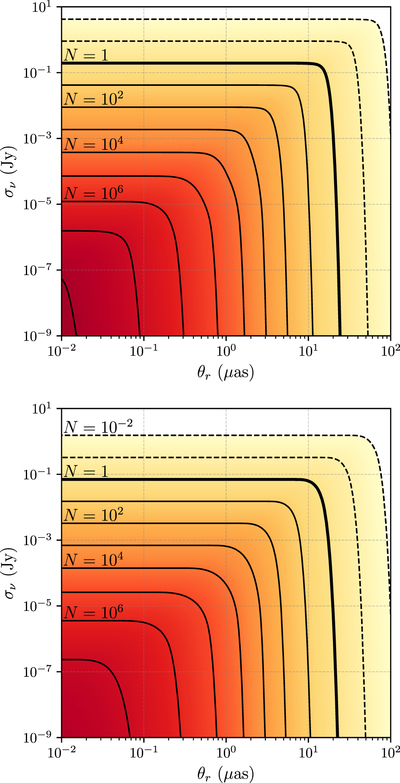
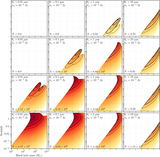
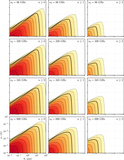
Caption: Figure 4.
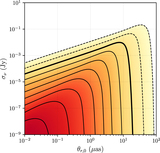
Top: number of black hole shadows with angular sizes larger than an angular resolution threshold θr and total flux densities larger than a sensitivity threshold σν, as a function of the threshold values and assuming an observing frequency of 230 GHz; that is, N(θr, σν) from Equation (7). The solid contours start with the thick contour indicating a count of N = 1 and then increase by factors of 10 toward the lower left, while the dashed contours each decrease by a factor of 10 toward the upper right. Bottom: same as the top panel, but with the additional restriction that the sources must be optically thin.
Other Images in This Article

Show More
Copyright and Terms & Conditions
© 2021. The Author(s). Published by the American Astronomical Society.