Image Details
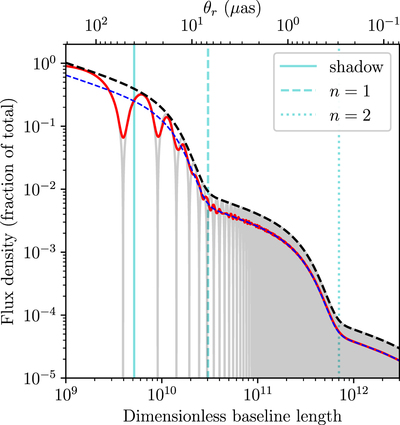
Caption: Figure 6.
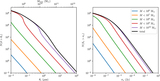
Fraction of the total source flux density that can be detected on long baselines for the photon ring model described in Section 3.1, shown here for a ϑ = 40 μas diameter. The gray curve shows Equation (17), and the dashed black line tracks the envelope of this function. The red curve shows a running average of the gray curve across a 2% fractional observing bandwidth, and the dashed blue curve shows Equation (19). The vertical cyan lines show the resolution criteria used for the shadow (θr = ϑ) and for the first two orders of photon ring (θr = 2wn−1).
Other Images in This Article


Show More
Copyright and Terms & Conditions
© 2021. The Author(s). Published by the American Astronomical Society.
Copyright ©
2025 Astronomy Image Explorer. All Rights Reserved.