Image Details
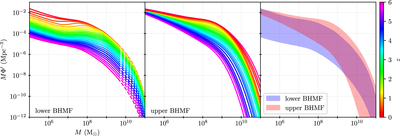
Caption: Figure 2.
Black hole mass functions used in this paper; see Section 2.2 for details about each BHMF. The left panel shows the lower BHMF from Shankar et al. (2009), with our extrapolation to higher SMBH masses (i.e., M > 109.5 M⊙, as proposed by Natarajan & Treister 2009) shown using dashed lines; the BHMF is colored by redshift. The center panel shows the upper BHMF constructed using the UNIVERSEMACHINE SMF with the Kormendy & Ho (2013) scaling relation. The right panel shows the envelopes (between z = 0 and z = 6) of the BHMFs from the left and middle panels, overlaid to ease comparison. All three panels share the same horizontal and vertical axis ranges, which are explicitly labeled in the left panel.
Other Images in This Article


Show More
Copyright and Terms & Conditions
© 2021. The Author(s). Published by the American Astronomical Society.