Image Details
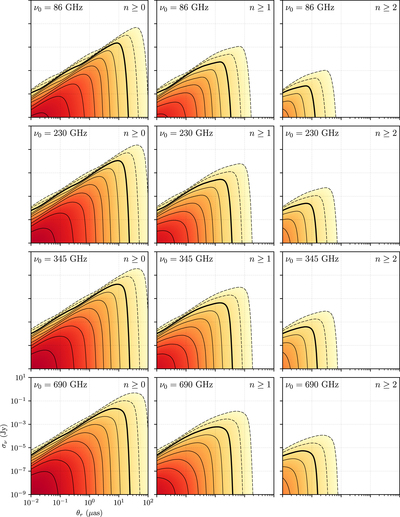
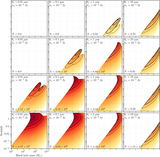
Caption: Figure 9.
Each panel shows a plot analogous to that in Figure 7, but decomposed into the number of sources for which we could expect to detect the first three orders of photon ring. Each row shows this decomposition for one of four observing frequencies, with the frequency labeled in the upper left-hand corner of each panel. For each row of panels, the left panel shows the number of sources for which we could detect any order of photon ring at all, while the center and right panels show the number of sources for which we could detect the first- and second-order photon rings, respectively. In each panel, the drawn contours mark the same source count values as those in Figure 4. All panels share the same horizontal and vertical axis ranges, which are explicitly labeled in the bottom-left panel.
Other Images in This Article


Show More
Copyright and Terms & Conditions
© 2021. The Author(s). Published by the American Astronomical Society.