Image Details
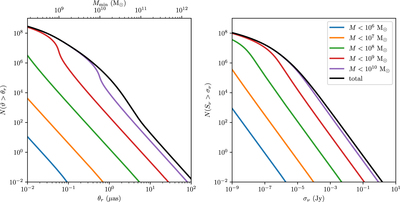
Caption: Figure 5.
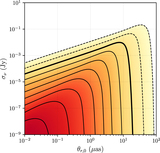
One-dimensional slices through N(θr, σν) for an observing frequency of 230 GHz, with no restriction on the optical depth τ. Left: the black curve shows the total number of SMBHs with shadows larger than some threshold angular resolution θr as a function of that threshold; this curve approximately corresponds to a horizontal cut through the bottom part of the top panel of Figure 4. The upper axis indicates the minimum mass of a black hole for which the corresponding angular resolution would permit that black hole to be spatially resolved at any redshift. Right: the black curve shows the total number of SMBHs with horizon-scale flux densities larger than some threshold value σν as a function of that threshold; this curve approximately corresponds to a vertical cut through the left part of the top panel of Figure 4. In both panels, the source counts for different choices of black hole mass binning are shown as colored curves.
Other Images in This Article


Show More
Copyright and Terms & Conditions
© 2021. The Author(s). Published by the American Astronomical Society.