Image Details
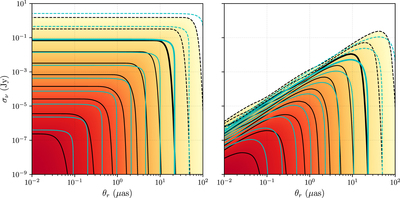
Caption: Figure 17.
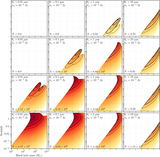
Left: same as the bottom panel of Figure 4, but with the source counts predicted by the best-fitting analytic approximation (Equation (C2)) overplotted in cyan contours. Right: same as Figure 7, but with the source counts predicted by the best-fitting analytic approximation (Equation (C5)) overplotted in cyan contours.
Other Images in This Article


Show More
Copyright and Terms & Conditions
© 2021. The Author(s). Published by the American Astronomical Society.
Copyright ©
2025 Astronomy Image Explorer. All Rights Reserved.