Image Details
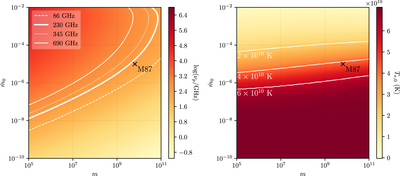
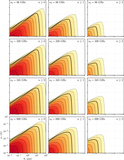
Caption: Figure 14.
Left: the peak synchrotron frequency, νp, at ﹩{R}_{\min }﹩ as a function of m and ﹩\dot{m}﹩. The white curves show contours at four different observing frequencies of interest, such that at any given frequency objects located to the lower right of the curve are expected to have optically thin emission. Right: the self-consistent value determined for Te,0 as a function of m and ﹩\dot{m}﹩. In both panels, the approximate mass (6.5 × 10⁹ M⊙) and accretion rate (λ = 10−5) corresponding to the SMBH in M87 is marked in black.
Other Images in This Article


Show More
Copyright and Terms & Conditions
© 2021. The Author(s). Published by the American Astronomical Society.
Copyright ©
2025 Astronomy Image Explorer. All Rights Reserved.