Image Details
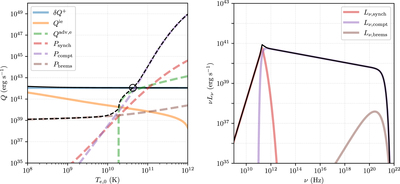
Caption: Figure 13.
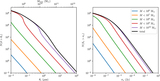
Left: an example set of electron heating and cooling curves used in the SED model as a function of Te,0, for an M87-like SMBH with m = 6.5 × 10⁹ and ﹩{\dot{m}}_{0}={10}^{-5}﹩. Solid colored curves indicate sources of electron heating, while dashed colored curves indicate sources of electron cooling; the total heating and cooling are plotted as the black solid and dashed lines, respectively. The intersection of these lines is circled and indicates where the heating and cooling are balanced (see Equation (A1)), which for this system occurs at Te,0 = 4.3 × 10¹⁰ K. Right: the SED corresponding to the solution from the left panel, with the individual contributions from synchrotron, inverse Compton, and bremsstrahlung emission plotted as colored curves and the combined spectrum plotted in black. For a 17 Mpc assumed distance to M87, the predicted 230 GHz flux density is ∼1 Jy. This prediction agrees well with the horizon-scale flux density measured by the EHT (Event Horizon Telescope Collaboration et al. 2019d).
Other Images in This Article


Show More
Copyright and Terms & Conditions
© 2021. The Author(s). Published by the American Astronomical Society.