Image Details
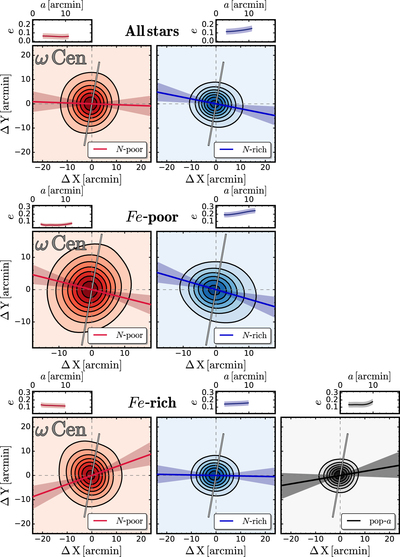
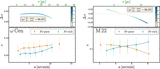
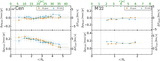
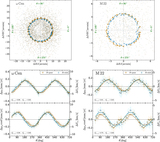
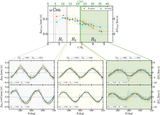
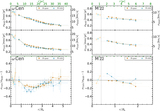
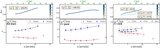
Caption: Figure 9.
Density maps of stellar populations of ω Centauri with different nitrogen abundances and of population-a stars. The top and center rows refer to Fe-poor and Fe-rich stars, respectively, while the bottom panels show the spatial distribution of the entire sample of N-poor and N-rich stars. The ellipticities of the isodensity contours are plotted as a function of the semimajor axis.
Other Images in This Article
Show More
Copyright and Terms & Conditions
© 2020. The American Astronomical Society. All rights reserved.
Copyright ©
2026 Astronomy Image Explorer. All Rights Reserved.