Image Details
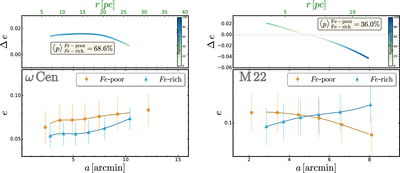
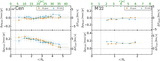
Caption: Figure 4.
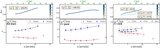
Ellipticity, e, of ellipses that best fit the spatial distribution of the different stellar populations of ω Centauri (left) and M22 (right) against the semimajor axis, a (lower panels). The upper panels show the difference between the ellipticity profiles as a function of a. The color level indicates the statistical significance of the difference, as indicated by the color bar. See text for details.
Other Images in This Article
Show More
Copyright and Terms & Conditions
© 2020. The American Astronomical Society. All rights reserved.
Copyright ©
2026 Astronomy Image Explorer. All Rights Reserved.