Image Details
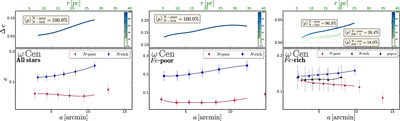
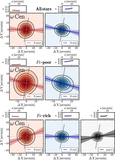
Caption: Figure 10.
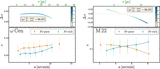
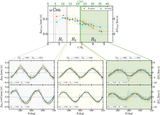
Lower panels: ellipticity of N-rich and N-poor stellar populations as a function of the major semiaxis of the best-fit ellipses, a for in the entire sample of analyzed ω Centauri stars (left), among Fe-poor stars (middle) and Fe-rich stars (right). The latter panel also includes population-a stars. Upper panels: absolute values of ellipticity differences inferred from the populations quoted in each panel against a. The color levels indicate the statistical significance of the difference as indicated by the color bar.
Other Images in This Article
Show More
Copyright and Terms & Conditions
© 2020. The American Astronomical Society. All rights reserved.
Copyright ©
2026 Astronomy Image Explorer. All Rights Reserved.