Image Details
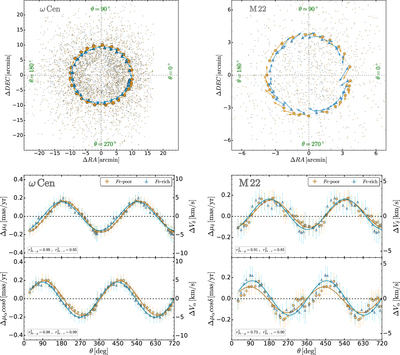
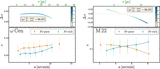
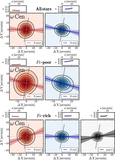
Caption: Figure 6.
Top panels: relative positions of Fe-poor and Fe-rich RGB stars in ω Centauri and M22 with respect to the cluster center. Orange and cyan arrows indicate the average motion computed in each circular sector, as described in Section 4.2, scaled by a factor of 5 for clarity. The radial distances of the arrows correspond to the median radius of stars in each population. Bottom panels: ﹩{\rm{\Delta }}{\mu }_{\alpha }\cos \delta ﹩ and ﹩{\rm{\Delta }}{\mu }_{\delta }﹩ as a function of θ for the two analyzed clusters. The bottom left insets show the value of the r2 parameter, which is indicative of the quality of the fit.
Other Images in This Article
Show More
Copyright and Terms & Conditions
© 2020. The American Astronomical Society. All rights reserved.