Image Details
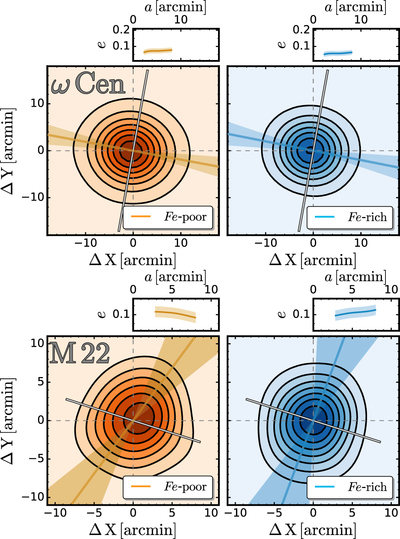
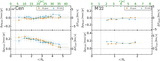
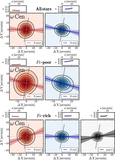
Caption: Figure 3.
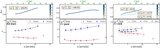
Density maps of metal-rich and metal-poor populations in ω Centauri (top panels) and M22 (bottom panels). The quantities on the abscissa and ordinate are the projected stellar coordinates relative to the cluster center. The color levels are indicative of stellar density and are based on the 2D binned kernel-density estimate (Wand 2015). The iso(density contours are shown in each panel together with the rotation axis as determined in Sollima et al. (2019) solid black-gray line). Red and blue lines in the top insets show the ellipticity against the major axis, while the shaded regions represent the 1σ confidence bands.
Other Images in This Article
Show More
Copyright and Terms & Conditions
© 2020. The American Astronomical Society. All rights reserved.