Image Details
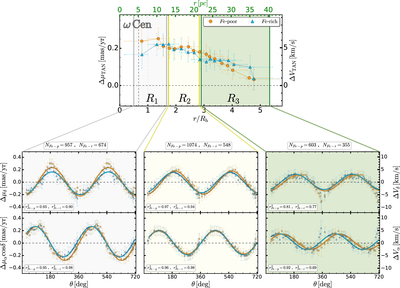
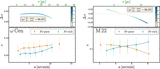
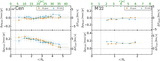
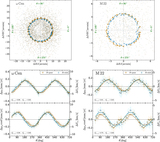
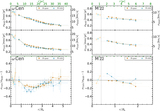
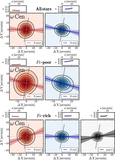
Caption: Figure 7.
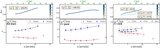
Top panel: reproduction of the ΔμTAN vs. r/Rh diagram of Fe-poor and Fe-rich stars in ω Centauri plotted in Figure 5. Bottom panels: ﹩{\rm{\Delta }}{\mu }_{\alpha }\cos \delta ﹩ and ﹩{\rm{\Delta }}{\mu }_{\delta }﹩ against the position angle θ for stars in regions R1–R3 defined in the upper panel. The sine functions that provide the best fit with the observations of Fe-poor and Fe-rich stars are represented with orange and azure lines, respectively.
Other Images in This Article
Show More
Copyright and Terms & Conditions
© 2020. The American Astronomical Society. All rights reserved.
Copyright ©
2026 Astronomy Image Explorer. All Rights Reserved.