Image Details
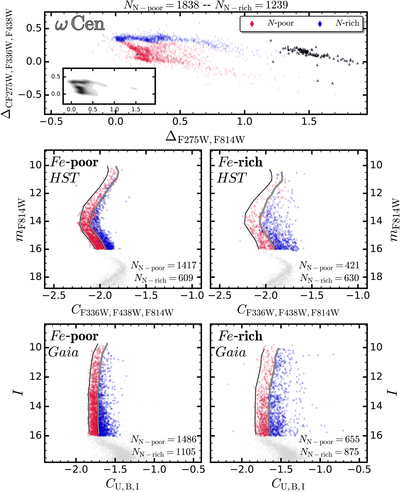
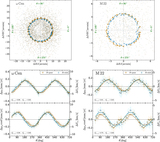
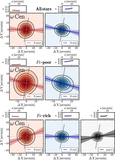
Caption: Figure 2.
Top panel: pseudo-two-color diagram, i.e., the ChM of ω Centauri. We adopted the selection criteria of Marino et al. (2019) to identify stars with different nitrogen abundances. Specifically, N-poor stars (lower and middle stream) are represented with red diamonds, while N-rich stars (upper stream) are marked with blue diamonds. pop-a stars are marked with solid black triangles. The bottom left inset shows the 2D-KDE of the same ChM. Middle panels: ﹩{m}_{{\rm{F}}814{\rm{W}}}﹩ vs. ﹩{C}_{{\rm{F}}336{\rm{W}},{\rm{F}}438{\rm{W}},{\rm{F}}814{\rm{W}}}﹩ for Fe-poor (left) and Fe-rich (right) stars as selected in Section 3. The fiducial lines in the CMDs are derived with the purpose of distinguishing stellar populations with different nitrogen abundances among stars with different iron. Lower panels: I vs. ﹩{C}_{{\rm{U}},{\rm{B}},{\rm{I}}}﹩ again for metal-poor (left) and metal-rich stars (right). The separation into N-poor and N-rich stars is derived by shifting the bluest RGBs from the quantity derived in the HST CMDs, as discussed in Section 5.
Other Images in This Article
Show More
Copyright and Terms & Conditions
© 2020. The American Astronomical Society. All rights reserved.