Image Details
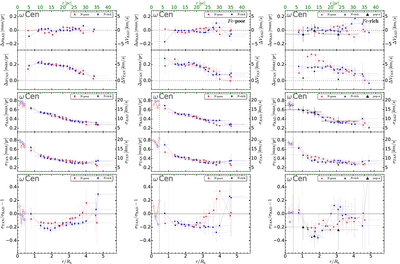
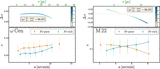
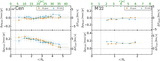
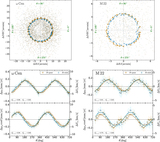
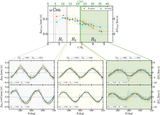
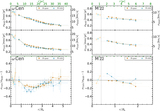
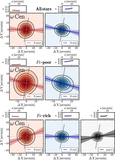
Caption: Figure 12.
From top to bottom: average velocity, velocity dispersion, and anisotropy profiles as a function of the distance from the cluster center for N-poor (red dots) and N-rich (blue triangles) stars. the left panels refer to the entire sample of ω Centauri stars, and in the middle and right panels we considered the Fe-poor and Fe-rich populations, respectively. The velocity profiles of population-a stars are plotted with black triangles in the right panels. The black and gray vertical dashed lines highlight the core radius and the half-light radius from Baumgardt & Hilker (2018). The radial quantity is normalized over the half-light radius.
Other Images in This Article
Show More
Copyright and Terms & Conditions
© 2020. The American Astronomical Society. All rights reserved.