Image Details
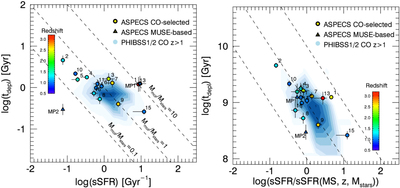
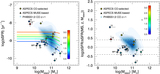
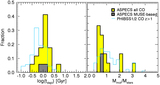
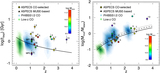
Caption: Figure 9.
Molecular gas depletion timescale (tdep) as a function of the specific SFR for the ASPECS CO galaxies. In both panels, the background blue contour levels represent the distribution of z > 1 PHIBSS1/2 CO galaxies (Tacconi et al. 2013, 2018), and the coloring of each ASPECS source represents its respective redshift. The left panel shows tdep as a function of sSFR. Here the dashed lines represent curves of fixed gas fraction (Mmol/Mstars). The right panel shows the sSFR normalized by the value of the sSFR expected for the MS (which is a function of the redshift and stellar mass) from Schreiber et al. (2015). In this case, the dashed lines are shown only for visualization purposes. A fixed conversion factor αCO = 3.6 (K km s−1 pc2)−1 has been assumed for the ASPECS CO sources. The comparison sample uses a metallicity-based prescription for this parameter. Typical values will range between αCO = 2–5 M⊙ (K km s−1 pc2)−1 for the ASPECS CO sources.
Other Images in This Article
Show More
Copyright and Terms & Conditions
© 2019. The American Astronomical Society. All rights reserved.