Image Details
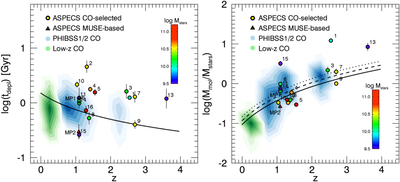
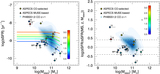
Caption: Figure 10.
Evolution of the tdepl and fmol = Mmol/Mstars with redshift. The background blue contour levels represent the distribution of galaxies from the PHIBSS1/2 compilation (Tacconi et al. 2013, 2018). As a reference in redshift, we also show as green contours the distribution of galaxies detected in CO line emission at z < 0.5 from the PHIBSS1/2 compilation (e.g., from xCOLDGASS, GOALS, and EgNOG surveys). The solid lines show the expected evolution of tdepl and fmol with redshift, based on previous targeted observations of star-forming galaxies. A fixed conversion factor αCO = 3.6 (K km s−1 pc2)−1 has been assumed for the ASPECS CO sources. The comparison sample uses a metallicity-based prescription for this parameter. Typical values will range between αCO = 2–5 M⊙ (K km s−1 pc2)−1 for the ASPECS CO sources.
Other Images in This Article
Show More
Copyright and Terms & Conditions
© 2019. The American Astronomical Society. All rights reserved.