Image Details
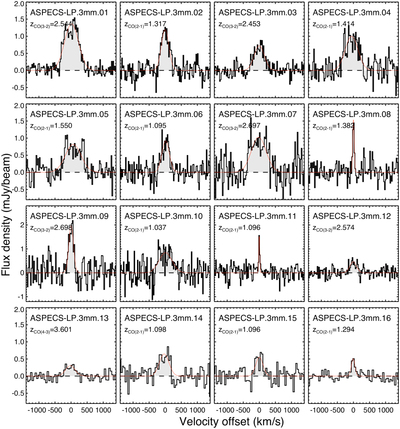
Caption: Figure 2.
CO line emission profiles obtained from the ALMA 3 mm data cube, toward the 16 most significant CO-selected detections. The spectra are centered at the identified line, and shown at a width of 7.813 MHz per channel (∼25 km s−1). For the sources in the bottom row, the spectra have been rebinned by a factor of 2. The red solid line, represents a one-dimensional Gaussian fit to the profiles. The profiles are obtained by extracting the spectra in the original cube, at the location of the peak position identified in the moment-0 image. The gray shaded area corresponds to the velocity range used to obtain the moment-0 images used in Figure 1.
Other Images in This Article
Show More
Copyright and Terms & Conditions
© 2019. The American Astronomical Society. All rights reserved.