Image Details
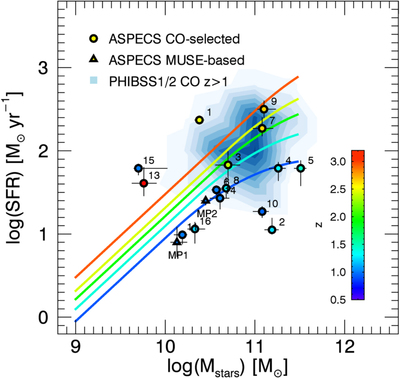
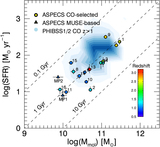
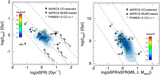
Caption: Figure 5.
SFR vs. stellar mass diagram for the ASPECS CO sources, compared to PHIBSS1/2 CO sources at z > 1. The PHIBSS1/2 galaxies are represented by the blue contours. The solid lines represent the observational relationships between SFR and stellar mass at different redshifts derived by Schreiber et al. (2015). These redshifts are denoted in different colors as shown by the color bar to the right. Three of the ASPECS CO-selected galaxies lie >0.4 dex below the MS at their respective redshifts (3 mm.2 and 3 mm.10).
Other Images in This Article
Show More
Copyright and Terms & Conditions
© 2019. The American Astronomical Society. All rights reserved.
Copyright ©
2025 Astronomy Image Explorer. All Rights Reserved.