Image Details
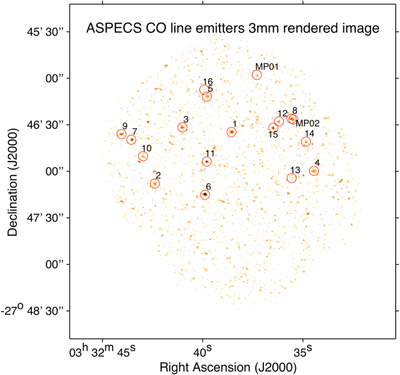
Caption: Figure 1.
Rendered CO image toward the HUDF, obtained by coadding the individual average CO line maps around the 16 bright CO-selected galaxies and the 2 lower significance MUSE-based CO sources (labeled MP). Regions with significances below 2.5σ in each of the average maps are masked out prior to combination. The location of these individual detections is highlighted by solid circles and their IDs. The tendency of sources to lie in the top two-thirds of the map is likely a combination of clustering and chance, given the sensitivity of the observations is fairly uniform across this region. We note that in this representation of the combined CO map, some individual images might have larger weight (lower noise) than others, and thus some noise peaks might appear as brighter than other statistically significant sources.
Other Images in This Article
Show More
Copyright and Terms & Conditions
© 2019. The American Astronomical Society. All rights reserved.