Image Details
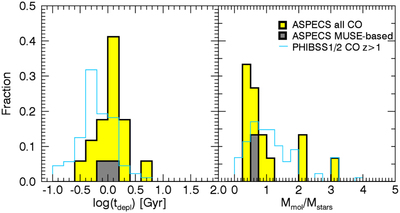
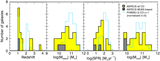
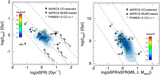
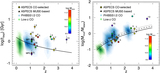
Caption: Figure 8.
Distribution of derived ISM properties (gas depletion timescale and gas fraction) for the CO line sources in the ASPECS field. The black solid, yellow shaded histogram represents the distributions of all ASPECS sources (both CO and MUSE based). The gray shaded histogram shows the distribution of the MUSE-based sources only. The light blue histograms show the distribution of z > 1 PHIBSS1/2 CO sources (Tacconi et al. 2013, 2018). Due to its uncertain counterpart photometry, 3 mm.12 is not considered in this figure. Sources 3 mm.1 and 3 mm.13 have high values of Mmol/Mstars falling outside the range covered by this figure. A fixed conversion factor αCO = 3.6 (K km s−1 pc2)−1 has been assumed for the ASPECS CO sources. The comparison sample uses a metallicity-based prescription for this parameter. Typical values will range between αCO = 2–5 (K km s−1 pc2)−1 for the ASPECS CO sources.
Other Images in This Article
Show More
Copyright and Terms & Conditions
© 2019. The American Astronomical Society. All rights reserved.