Image Details
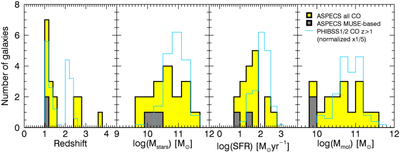
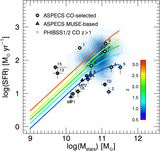
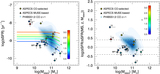
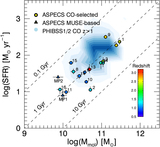
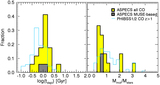
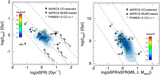
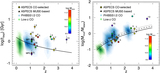
Caption: Figure 4.
Distribution of galaxy properties (SFR, stellar mass, specific SFR, and derived gas mass) for the CO line sources in the ASPECS field. The black solid, yellow shaded histograms represent the distributions of all ASPECS CO sources (both CO and MUSE based). The gray shaded histograms present the distribution of the MUSE-based sources only. The light blue histograms show the distribution of the z > 1 PHIBSS1/2 CO sources (Tacconi et al. 2013, 2018). The number of PHIBSS1/2 sources is normalized by a factor of one-fifth for displaying purposes. Due to its uncertain photometry and thus SED fit, 3 mm.12 is not considered in this figure. A fixed conversion factor αCO = 3.6 (K km s−1 pc2)−1 has been assumed for the ASPECS CO sources. The comparison sample uses a metallicity-based prescription for this parameter.
Other Images in This Article
Show More
Copyright and Terms & Conditions
© 2019. The American Astronomical Society. All rights reserved.