Image Details
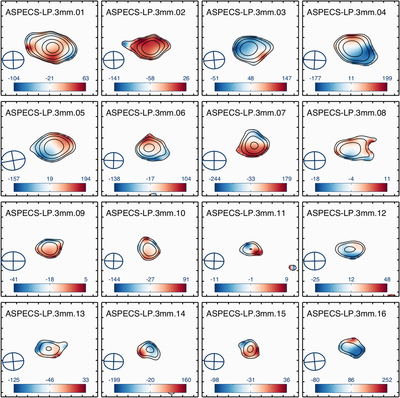
Caption: Figure 15.
Postage stamps of the CO moment-1 (velocity fields) toward the ASPECS CO sources. The background image represents the velocity field, with bluer and redder colors representing the approaching and receding CO components. The black contours show the moment-0 map, shown at levels 3, 6, 10, 15, 20, and 30σ, where σ is the rms measured in this map. The color bar presented in the bottom of each panel shows the velocity scale in each case with respect to the CO central velocity, in units of kilometers per second. The blue ellipse to the left side of each panel represents the beam size at the observed frequency.
Other Images in This Article
Show More
Copyright and Terms & Conditions
© 2019. The American Astronomical Society. All rights reserved.