Image Details
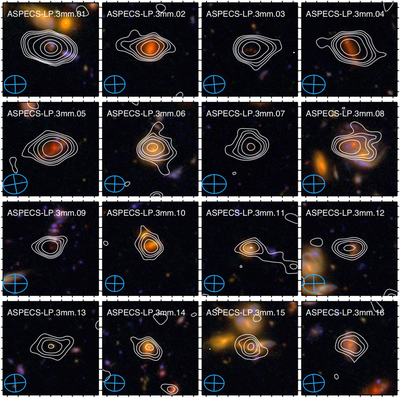
Caption: Figure 14.
Optical/near-IR postage stamps compared to the CO emission for the ASPECS CO-selected sample. HST RGB images (F435W, F850LP, and F105W) are shown in the background with white contours overlaid representing the CO line emission at significances 2, 3, 4, 6, 10, 20, and 30σ, where σ is the rms noise level of each CO moment-0 image.
Other Images in This Article
Show More
Copyright and Terms & Conditions
© 2019. The American Astronomical Society. All rights reserved.
Copyright ©
2025 Astronomy Image Explorer. All Rights Reserved.