Image Details
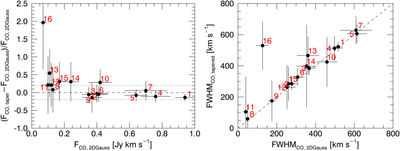
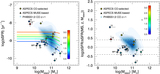
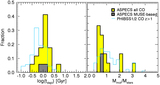
Caption: Figure 12.
Comparison of the CO flux measurements and line widths obtained from two-dimensional Gaussian fitting in the original resolution moment-0 maps vs. the ones obtained from the measurements in the 3″ tapered cubes. Dotted lines in the top panel indicate lines of 20% difference between these estimates. The dashed lines indicate the location of identical estimates by both methods.
Other Images in This Article
Show More
Copyright and Terms & Conditions
© 2019. The American Astronomical Society. All rights reserved.
Copyright ©
2025 Astronomy Image Explorer. All Rights Reserved.