Image Details
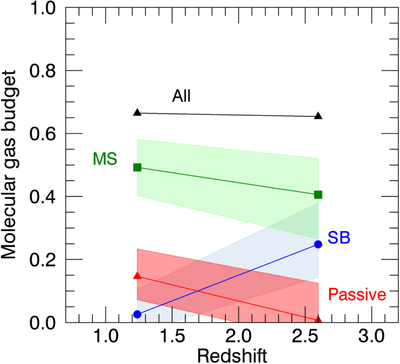
Caption: Figure 11.
Contribution to the total molecular gas budget from galaxies above (starburst), in, or below (passive) the MS as a function of redshift inferred from the ASPECS survey. The blue, green, and red data points and lines represent galaxies above, in, and below the MS, respectively. The black curve shows the contribution of all the CO-selected galaxies considered here to the total molecular gas at each redshift. Each data point is computed from the sum of molecular gas masses of all galaxies in that redshift bin and galaxy type. The redshift measurement of each point is computed as the average redshift from all galaxies in that bin. The shaded region corresponds to the uncertainties of each measurement.
Other Images in This Article
Show More
Copyright and Terms & Conditions
© 2019. The American Astronomical Society. All rights reserved.