Image Details
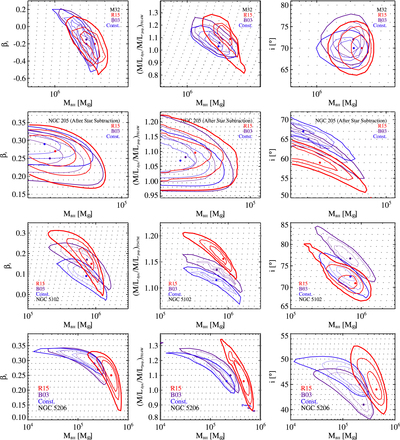
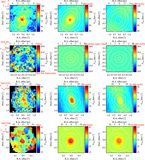
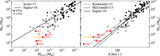
Caption: Figure 6.
Best-fit JAMs. The red contours and dots show our reference model in each galaxy based on the R15 color–M/L relation. The blue and purple contours and dots give the B03 and constant M/L mass models. Contours show Δχ2 = 2.30, 6.18 (dashed lines), and 11.83 (solid line), corresponding to 1σ, 2σ, and 3σ confidence levels for two parameters after marginalizing over the other two parameters. The gray dots show the grid of models. The columns show the BH mass vs. the anisotropy, βz (left); mass scaling factor, ﹩\gamma =M/{L}_{\mathrm{dyn}.}/M/{L}_{\mathrm{pop}.}﹩ (center); and inclination, i (right).
Other Images in This Article
Show More
Copyright and Terms & Conditions
© 2018. The American Astronomical Society. All rights reserved.
Copyright ©
2026 Astronomy Image Explorer. All Rights Reserved.