Image Details
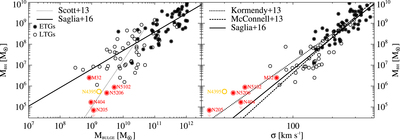
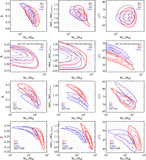
Caption: Figure 10.
Our four low-mass ETGs in the context of the ﹩{M}_{\mathrm{BH}}﹩–﹩{M}_{\mathrm{Bulge}}﹩ (left) and ﹩{M}_{\mathrm{BH}}﹩–σ (right) scaling relations. The data of both ETGs (black dots within open circles) and LTGs (black open circles) are taken from the compilation of Saglia et al. (2016). The dotted, dashed, long-dashed, and solid lines indicate their linear best fit in log scale of the relations from Scott et al. (2013), Kormendy & Ho (2013), McConnell & Ma (2013), and Saglia et al. (2016) for ETGs (LTGs), respectively. The BH masses of M32, NGC 5102, and NGC 5206 and 3σ upper limit mass of NGC 205 with the downward arrow are plotted with red dots within open circles, as in the legend. We also add BHs with dynamical masses below 106 M⊙, including the dwarf AGN LTG NGC 4395 (yellow open circle; den Brok et al. 2015) and ETG NGC 404 (Nguyen et al. 2017).
Other Images in This Article
Show More
Copyright and Terms & Conditions
© 2018. The American Astronomical Society. All rights reserved.