Image Details
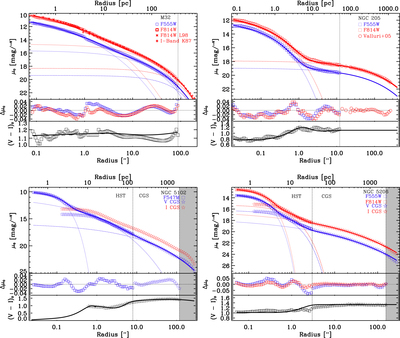
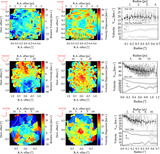
Caption: Figure 1.
The SB profiles of each galaxy studied here. The profiles are constructed from a combination of ground-based and HST imaging. The blue lines show V/F555W/F547M profiles, while the red lines show I/F814W profiles. All magnitudes/colors are corrected for foreground extinction. Symbols show the data, while the best-fitting 1D SB profiles are shown as solid lines. Each component of the best-fit models is also plotted for visualization (the innermost Sérsic component is shown as a dotted line, the second largest is shown as a dashed line, and, when present, the outermost component is shown as a long-dashed line). The residuals of the fits are shown in the middle panels, and the ﹩{(V-I)}_{o}﹩ color profiles are illustrated in the bottom panels, including the data (black symbols) and the best-fit model (black line). Different symbols are plotted correspondingly to their data sets, which are shown in the legend of each top panel. The inner and outer vertical dashed lines show the ends of the HST and ground-based data, respectively. The gray regions in the plots of NGC 5102 and NGC 5206 indicate the areas beyond our fitting radius.
Other Images in This Article
Show More
Copyright and Terms & Conditions
© 2018. The American Astronomical Society. All rights reserved.