Image Details
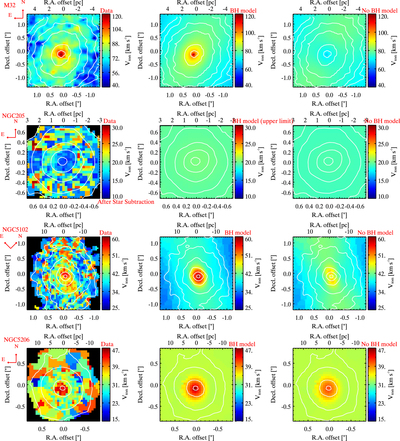
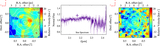
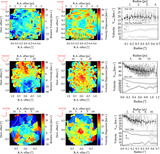
Caption: Figure 8.
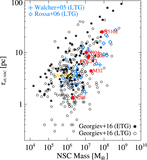
A 2D data-model comparison of JAMs with and without BHs. The left panels show maps of Vrms data in each galaxy, the middle panels show the best-fit JAM 2D maps, and the right panels show the best-fit models without a BH. These models are the same as those shown in 1D in Figure 7. The white contours show the continuum, and the red arrows show the orientation.
Other Images in This Article
Show More
Copyright and Terms & Conditions
© 2018. The American Astronomical Society. All rights reserved.
Copyright ©
2024 Astronomy Image Explorer. All Rights Reserved.