Image Details
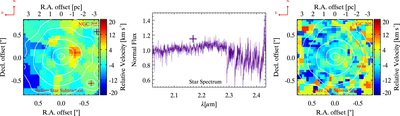
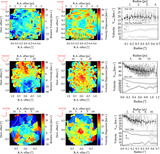
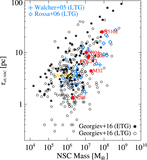
Caption: Figure 4.
Left panel: radial velocity map derived from CO band-head spectroscopy from Gemini/NIFS of NGC 205 before central resolved star subtraction. The white intensity contours plotted on top of the map show those resolved stars in the FOV with the two brights in the northwest (purple plus sign) and southwest (red plus sign) of the map. Middle panel: spectrum of the brightest (purple plus sign) star shown in the same color. Right panel: radial velocity map derived from CO band-head spectroscopy from Gemini/NIFS of NGC 205 after central resolved star subtraction (Section 5.2). The white intensity contours after the subtraction of resolved stars are now smoother.
Other Images in This Article
Show More
Copyright and Terms & Conditions
© 2018. The American Astronomical Society. All rights reserved.