Image Details
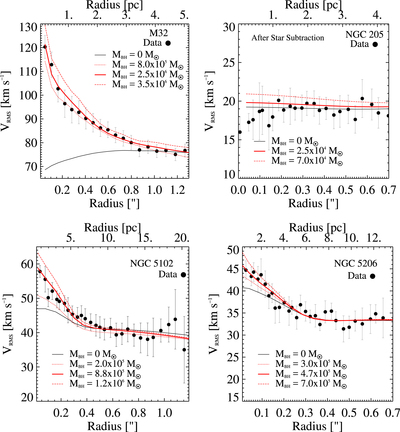
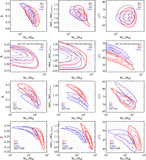
Caption: Figure 7.
The 1D Vrms vs. JAM predictions of mass models with varying BH masses. The red solid lines show our best-fit JAMs. The long-dashed and short-dashed lines indicate the upper and lower range of BH masses within 3σ (see Figure 6 and Table 6), while the black lines show the best-fit JAMs without a BH. All models are fixed to the corresponding best-fit inclination angles of galaxies (column 9, Table 6) but varying for anisotropy, mass scaling ratio, and BH mass, which will be written in the form of (βz, γ, ﹩{M}_{\mathrm{BH}}﹩, i). The specific zero-mass and best-fit BH models plotted have (0.10, 1.20, 0 M⊙, 70°) and (−0.2, 1.08, 2.5 × 10⁶ M⊙, 70°) for M32, (0.27, 1.12, 0 M⊙, 63°) and (0.27, 1.10, 7.0 × 10⁴ M⊙, 55°) for NGC 205, (0.26, 1.19, 0 M⊙, 71.°5) and (0.15, 1.15, 8.8 × 10⁵ M⊙, 71.°5) for NGC 5102, and (0.30, 1.16, 0 M⊙, 44.°5) and (0.25, 1.06, 4.7 × 10⁵ M⊙, 45.°5) for NGC 5206. Both the Vrms profiles of spectroscopic data and their corresponding JAM predictions are binned radially in the same manner for all galaxies as presented in the right panels of Figure 5. The error bars are 1σ deviations of the kinematic measurements of the Voronoi bins in the same annuli.
Other Images in This Article
Show More
Copyright and Terms & Conditions
© 2018. The American Astronomical Society. All rights reserved.