Image Details
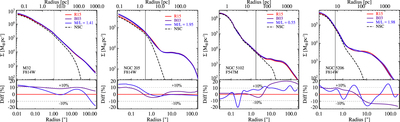
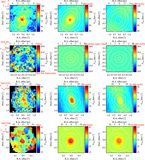
Caption: Figure 3.
Top panels: comparison of the mass surface density models in each galaxy. These models are created using MGEs constructed from our GALFIT models. These MGEs are then multiplied by an M/L to get a mass surface density. For the constant M/L model (blue lines), the chosen M/L is discussed in Section 4.3. For the other mass models, an M/L is assigned to each MGE based on the color of the galaxy at the radius of the MGE using the R15 or B03 color–M/L relation (red/purple lines); we use the R15 model as our default. Dashed black lines show the NSCs in the R15 model; their effective radii are shown by vertical lines. Bottom panels: to compare the relative mass distribution of the three different mass profiles for each galaxy, we plot their fractional difference relative to the R15 color–M/L relation.
Other Images in This Article
Show More
Copyright and Terms & Conditions
© 2018. The American Astronomical Society. All rights reserved.