Image Details
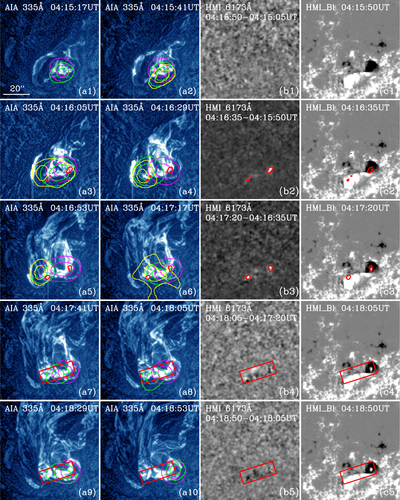
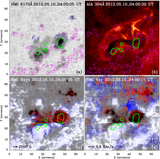
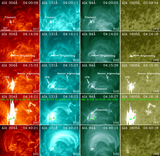
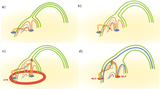
Caption: Figure 9.
(a1)–(a10) AIA 335 Å images processed using the Multi-Scale Gaussian Normalization (MGN) method. (b1)–(b5) The running difference images of HMI 6173 Å continuum intensity. (c1)–(c5) The HMI LOS magnetograms. All of these images have the same FOV. The red box marks the area where white-light emission enhancement occurred. The magenta, green, and yellow contours with levels of 70% and 90% of the maximum value show the REHSSI 12–25 keV, 25–50 keV. and 50–100 keV sources, respectively.
Other Images in This Article

Copyright and Terms & Conditions
© 2018. The American Astronomical Society. All rights reserved.
Copyright ©
2025 Astronomy Image Explorer. All Rights Reserved.