Image Details
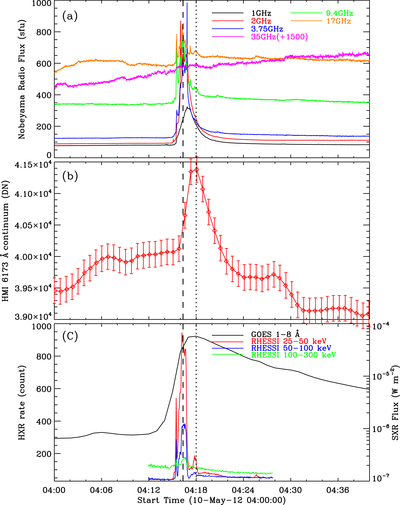
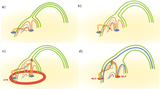
Caption: Figure 3.
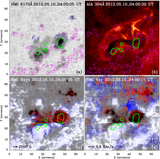
Temporal variations of the microwave (a); white light (b); and soft and hard X-ray (c) fluxes. The dashed line marks the peak times of microwave and hard X-ray fluxes. The dotted line marks the peak time of the white-light emission. In panel (b), the temporal variation of the HMI 6173 Å continuum intensity measures the average intensity in the region R2 that is defined in Figure 2(f) .
Other Images in This Article

Copyright and Terms & Conditions
© 2018. The American Astronomical Society. All rights reserved.
Copyright ©
2025 Astronomy Image Explorer. All Rights Reserved.